
The Crypto Fear & Greed Index has just printed 10 out of 100, which is not typically seen during a bad week or a rough month, but only at huge stress moments, such as the March 2020 COVID crash, the post-FTX washout in late 2022, or the crash in February this year.
At these levels, the question stops being “how scared are people?” and becomes “does extreme fear actually predict anything?”
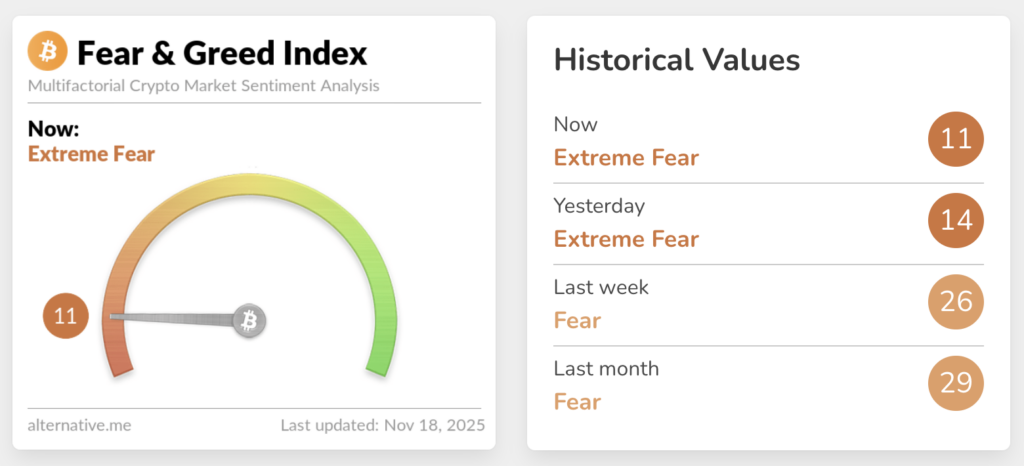
The index, created initially by Alternative.me based on CNN’s stock market index, compresses six market inputs into a single daily number. Volatility contributes 25% of the score, comparing current drawdowns against 30- to 90-day baselines.
There are now several versions of the index provided by other data companies, including CoinMarketCap, CoinStats, and CoinGlass. All of which still show ‘Extreme Fear’ as the current state of play at press time.
Market momentum and volume add another 25%, capturing whether buyers are aggressive or exhausted. Social media activity, Google Trends, Bitcoin dominance, and investor surveys provide a comprehensive picture.
A score of 10 sits near the absolute floor of the scale, in the “Extreme Fear” band that runs from 0 to 24.
Alternative.me pitches it as a contrarian tool: extreme fear may mean investors are overreacting and could mark an opportunity, while extreme greed often precedes corrections. They stop short of claiming hard predictive power.
The designers frame it as a sentiment barometer, not trading advice. That caveat matters because history shows these readings cluster around major stress points and medium-term value zones, but they don’t time bottoms with precision.
Historical analogues
In March 2020, Bitcoin fell roughly 50% in two days during the COVID panic, briefly touching $4,000 on Mar. 13. The next day, the Fear Index printed 8, the lowest reading in over four years.
Kraken’s research desk highlighted that number as capitulation-level fear. From those lows, BTC eventually climbed to $60,000 by early 2021. The sub-10 print landed within days of a major cycle bottom, but that bottom only held because the Federal Reserve cut rates to zero and launched unlimited quantitative easing.
The sentiment signal aligned with the liquidity intervention, but it didn’t cause the recovery.
November 2022 delivered another extreme reading. The FTX collapse drove Bitcoin under $17,000, with lows near $15,500. The Fear Index fell into the low teens, with some data providers citing readings around 12.
AlphaPoint’s post-mortem noted that the index languished in “extreme fear” for weeks while BTC chopped sideways near cycle lows.
The sentiment bottom and the price bottom were not on the same day or even the same week. From there, BTC eventually surpassed $73,000 by March 2024 and broke $100,000 in December 2024.
This year has produced just one extreme fear spike. In late February, the index reached 10 as Bitcoin fell below $86,000, marking the lowest sentiment reading since the 2022 bear market.
However, in mid-October, a surprise US tariff triggered the largest crypto liquidation event on record, with more than $19 billion in leveraged positions liquidated in 24 hours, roughly 19 times larger than the liquidation volumes of the 2020 and 2022 crashes did not invoke an ‘Extreme Fear’ reading. It held just above around 25 out of 100.
Now, as Bitcoin tumbled back to the $93,000 price level, the index reached 10 again as Bitcoin fell below $93,000, erasing year-to-date gains and triggering more than $1.1 billion in forced liquidations.
Volatility clusters and forced selling
The Fear Index doesn’t react to a single bad day. It tends to bottom during volatility clusters, which are periods where big moves bunch together rather than arriving in isolation.
Academic work on Bitcoin confirms the classic volatility clustering phenomenon: past volatility predicts future volatility, and extreme sentiment readings correlate strongly with spikes in trading activity and realized volatility across major cryptocurrencies.
The recent sell-offs fit that pattern. October’s tariff shock led to $19 billion in liquidations over 24 hours. November’s drop below $93,000 brought $1.1 billion in forced unwinds, with the RSI moving into oversold territory for the first time since FTX.
When the Fear Index prints 10, it captures the psychological expression of these volatility clusters: forced unwinds, thin order books, and macro shocks that feed into the same sentiment reading.
This distinction matters for understanding what comes next. Liquidity-driven bottoms form when flows and balance sheets force the issue: liquidations exhaust sellers, central banks intervene, ETF flows flip positive, or funding rates normalize.
Sentiment bottoms mark where psychology peaks, where measured fear maxes out.
March 2020 marked a significant low in liquidity. The crash started as a broad “everything must go” liquidation across all risk assets. The Fear Index sank to 8, but the lasting bottom was only established after the Fed flooded markets with liquidity through rate cuts and bond purchases.
Sentiment aligned with the bottom but didn’t cause it.
The 2022 FTX episode blended both dynamics. The collapse triggered a classic liquidity shock as one of the crypto industry’s largest exchanges failed. BTC fell to the mid-$15,000s, and the Fear Index dropped to around 12.
However, no central bank backstop arrived. Instead, the liquidity bottom came from time: insolvent leverage was flushed out over months, surviving venues rebuilt, and a new structural demand source emerged through the approval of spot Bitcoin ETFs in early 2024.
The sentiment index spent a long time in fear while the market was quiet.
In 2025, the picture is strongly driven by flow. BTC’s market depth has decreased from approximately $766 million in early October to around $535 million, making prices more susceptible to large orders.
US spot Bitcoin ETFs experienced $866 million in net outflows on Nov. 13, marking the second-largest daily redemption since their launch in January 2024. Over the past three weeks, cumulative outflows have totaled more than $2.3 billion.
The fear reading at 10 indicates traders are scared. The liquidation and ETF data suggest whether forced selling has actually run its course. Historically, durable cycle lows have required both sentiment capitulation and liquidity stabilization.
Near-term Catalysts
Two forces dominate the near-term outlook: Federal Reserve policy and ETF flows.
The Fed cut rates by 25 basis points at its October meeting, resuming the easing cycle that started in September. Economists widely expect another quarter-point reduction at the December 9-10 FOMC meeting, with further cuts likely in 2026 if inflation continues to cooperate.
Lower policy rates typically support duration-sensitive assets, such as Bitcoin, but the current fear reading suggests that markets worry growth is deteriorating faster than cuts can help.
ETF flows provide the cleaner real-time signal. Binance’s research arm noted that ETF inflows and large corporate buys from entities like Strategy were the dominant demand engines for BTC in 2025, and both have softened recently.
Weekly redemptions ran around $1.1 billion between November 10 and 14, driven by a broader tech-led risk-asset selloff, falling on-exchange liquidity, and jitters over large corporate holders.
That sets up a simple tension. If ETF outflows stabilize or reverse to net buying around the December FOMC meeting, history suggests that extreme fear can mark a medium-term opportunity window.
If outflows and liquidity erosion persist even after additional rate cuts, then the current fear reading is the midpoint of a longer deleveraging phase rather than its end.
Does extreme fear predict anything?
The empirical answer reveals a great deal about stress, but less about the exact timing.
Academic work is mixed. A 2024 Finance Research Letters paper finds a U-shaped relationship between the Fear Index and price synchronicity: both extreme fear and extreme greed lead to highly correlated, herd-driven moves.
Other studies find that including the index improves volatility forecasts, while at least one 2023 paper reports little consistent predictive power for future returns.
What is robust: extreme fear readings cluster near the worst of volatility and forced selling and have, in 2020 and 2022, coincided with broad zones where long-term investors who bought and held were well rewarded.
However, the path from those zones to a new uptrend can involve months of chop, false breaks, and more pain.
At 10 out of 100, the Fear Index is screaming capitulation. History says that’s when long-horizon buyers start paying attention, not when short-term traders suddenly gain clairvoyance.
The post Bitcoin sentiment has hit rock bottom – as bad as COVID and FTX crashes appeared first on CryptoSlate.

